Page History
...
The new release of Active-Framework is out and official and we're so impatient to share them it with you. We've been working hard those past few months based on your feedback to improve charts. We bring a lot of new features on this release with personnalisation, better usability, better exports... We introduce a new mechanism called "propagation" to easily fill-in the Niagara Network to share data between stations. We pushed the connector Framework to higher limits to let you personalize the payloads from a simple model. And finally but not the least we introduce a whole new range of blocks to manipulate data tables.
...
Charts are very essential but can be handy to parameter for an end user because it implies a lot of considerations to take into account. This is why we firstly introduced an automatic configuration based on tags so the end user wouldn't need to bother with any of it => The ; the charts display with the corrected parameters on the first click. The downside to it is the mandatory tagging to get it well. So we introduced a new configuration popup to personalize each chart: the color, the type of chart, the aggregation, the delta. You can now start with fresh histories without any worry on the tagging and personalize them.
...
The Model (e.g. Aspects) defined on a station needed to be copy-pasted from a station to another if you wanted to have a common Model. This period is over! The Nodes from the Model can now propagate between stations automatically. As soon as you create a Node somewhere it's replicated in the connected stations if desired. Strategies can be triggered automatically allowing you to create advanced scenarios for multi-JACEs architectures. You can also propagate actions to disable a Node with one action on every connected stations for example. This is a huge breakthrough and we hope you'll enjoy it!
...
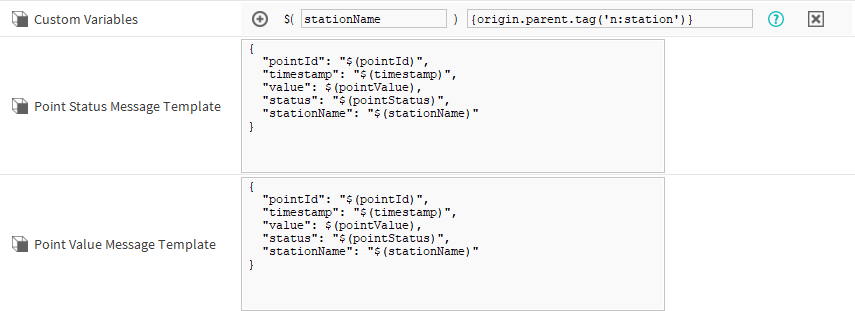
The connectors Framework is one of the main use of the Active-Framework as more Niagara stations are getting connected to different services, databases or platforms. As more 3rd party are involved with Niagara data, they expect more custom data formats. The system was thought dynamic in the setup in the station but the payloads and behaviors on the 3rd party was fixed. We made it entirely dynamic so you can personalize it from a simple JSON declaration model using SFormat. You need a new tag? Declare a new variable using SFormat (you can get any data in the station with it) and add it to the JSON payload. We are excited to be compliant with the UDMI format now!
...
History Table
...
calculations
Manipulating control points is super easy in Niagara with the Wiresheet, you can create mathematical operations between values (a temperature average for example). But it comes about manipulating histories it's not that simple. Series Transform are kind of frozen because you need to select each history manually. While being time consuming you can't reuse it from one station to another. So we introduce a whole new range of blocks to manipulate data tables: aggregate histories together, apply rollups, do some cost calculations etc.
...